.png)
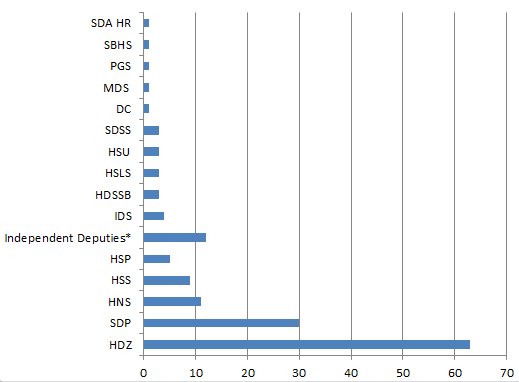
Party affiliation and distribution of parlamentary seats
|
Party Name |
Party MPs |
Non-party MPs |
Distribution |
Total |
% |
||
|
|
|
Ethnics Minorities |
Independent Non-party MPs |
Diaspora |
|
||
|
HDZ |
63 |
0 |
0 |
0 |
4 |
63 |
41,7 |
|
SDP |
30 |
3 |
0 |
3 |
0 |
30 |
19,9 |
|
HNS |
11 |
0 |
0 |
0 |
0 |
11 |
7,3 |
|
HSS |
9 |
0 |
0 |
0 |
0 |
9 |
6 |
|
HSP |
5 |
0 |
0 |
0 |
0 |
5 |
3.ožu |
|
Independent Deputies* |
12 |
9 |
4 |
0 |
0 |
9 |
7,9 |
|
IDS |
4 |
0 |
0 |
0 |
0 |
4 |
2,6 |
|
HDSSB |
3 |
0 |
0 |
0 |
0 |
3 |
2 |
|
HSLS |
3 |
0 |
0 |
0 |
0 |
3 |
2 |
|
HSU |
3 |
0 |
0 |
0 |
0 |
3 |
2 |
|
SDSS |
3 |
0 |
3 |
0 |
0 |
3 |
2 |
|
DC |
1 |
0 |
0 |
0 |
0 |
1 |
0,7 |
|
MDS |
1 |
0 |
0 |
0 |
0 |
1 |
0,7 |
|
PGS |
1 |
0 |
0 |
0 |
0 |
1 |
0,7 |
|
SBHS |
1 |
0 |
0 |
0 |
0 |
1 |
0,7 |
|
SDA HR |
1 |
0 |
1 |
0 |
0 |
1 |
0,7 |
|
TOTAL |
147 |
3 |
8 |
3 |
4 |
150 |
100 |
|
Data source: Internet Editorial Staff of the Croatian Parliament, 10 October 2007 |
|||||||
* There are 12 independent deputies, 3 of which are displayed as SDP non-party MPs (elected from SDPs voting list, members of SDP Deputy Club); 8 deputies are representing ethnic minorities, 4 of which are independent deputies.
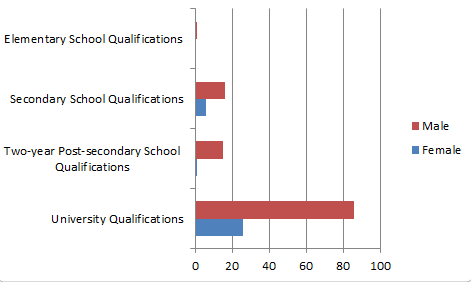
Educational background
|
Educational Background |
Female |
Male |
Total |
% |
|
University Qualifications |
26 |
86 |
112 |
74.2 |
|
Two-year Post-secondary School Qualifications |
1 |
15 |
16 |
10,6 |
|
Secondary School Qualifications |
6 |
16 |
22 |
14,6 |
|
Elementary School Qualifications |
0 |
1 |
1 |
0,7 |
|
TOTAL |
33 |
118 |
151 |
100 |
|
Data source: Internet Editorial Staff of the Croatian Parliament, 10 October 2007 |
||||
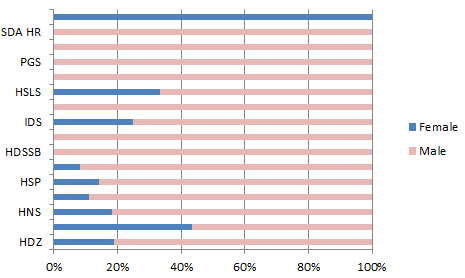
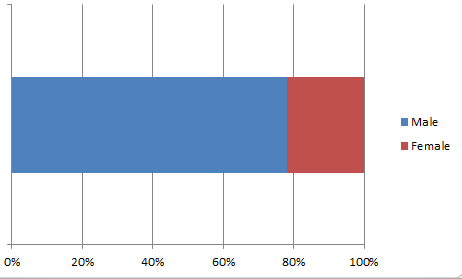
Gender
|
Party Name |
Total |
Female |
Male |
% Female |
|
HDZ |
63 |
12 |
51 |
8 |
|
SDP |
30 |
13 |
17 |
9 |
|
HNS |
11 |
2 |
9 |
1 |
|
HSS |
9 |
1 |
8 |
1 |
|
HSP |
5 |
1 |
6 |
1 |
|
Independent Deputies* |
12 |
1 |
11 |
1 |
|
HDSSB |
3 |
0 |
3 |
0 |
|
HSU |
3 |
0 |
3 |
0 |
|
IDS |
4 |
1 |
3 |
1 |
|
SDSS |
3 |
0 |
3 |
0 |
|
HSLS |
3 |
1 |
2 |
1 |
|
MDS |
1 |
0 |
1 |
0 |
|
PGS |
1 |
0 |
1 |
0 |
|
SBHS |
1 |
0 |
1 |
0 |
|
SDA HR |
1 |
0 |
1 |
0 |
|
DC |
1 |
1 |
0 |
1 |
|
TOTAL |
151 |
33 |
120 |
22 |
|
Data source: Internet Editorial Staff of the Croatian Parliament, 10 October 2007 |
||||
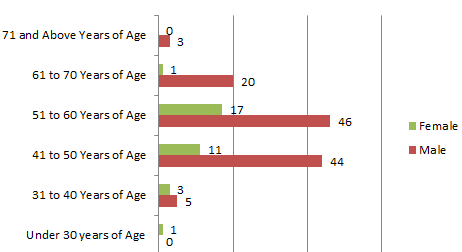
Age
|
Age Group |
TOTAL |
Male |
Female |
|
Under 30 years of Age |
1 |
0 |
1 |
|
31 to 40 Years of Age |
8 |
5 |
3 |
|
41 to 50 Years of Age |
55 |
44 |
11 |
|
51 to 60 Years of Age |
63 |
46 |
17 |
|
61 to 70 Years of Age |
21 |
20 |
1 |
|
71 and Above Years of Age |
3 |
3 |
0 |
|
TOTAL |
151 |
118 |
33 |
|
Data source: Internet Editorial Staff of the Croatian Parliament, 10 October 2007
|
, |
||